Master the Marubozu Candlestick: Trading Strong Trend Momentum
The Marubozu is a powerful candlestick with a long body and no shadows, showing complete control by either buyers or sellers. A Bullish Marubozu signals strong buying pressure, and a Bearish Marubozu aggressive selling. Many traders read it as a reversal, but Trading Metrics reads it as momentum: the push is more likely to carry on. Because of its clarity, this pattern highlights dominant momentum, and after a long run it can also be the last push rather than the first.
How to Identify the Marubozu Pattern in Trading
Spotting a Marubozu means recognizing a single candlestick with a long body and minimal shadows, signaling strong momentum in its direction - bullish or bearish - depending on context. It’s about unwavering force. Here’s the step-by-step guide.
Understand the Basics of the Marubozu Pattern
The Marubozu is a decisive candlestick that reflects dominant market pressure, either buying or selling.
- Bullish Marubozu: Shows strong buying from the open to the close; the push is more likely to carry on.
- Bearish Marubozu: Shows strong selling from the open to the close; the push is more likely to carry on.
Look for the Candlestick Shape in Price Movement
A single candle with a long body and little to no shadows.
- Bullish Marubozu: Opens near the low, closes near the high → relentless buying.
- Bearish Marubozu: Opens near the high, closes near the low → persistent selling.
The Trading Metrics scanner asks for three things: a body of at least 90% of the candle’s range, a wick on the closing side of at most 5% of the range, and a body of at least 1.5 times the average range (ATR 14) and at least 0.1% of the price. It has no prior-trend condition.
Identify the Confirmation Level
- Bullish Marubozu: Close above the Marubozu’s high confirms buying strength.
- Bearish Marubozu: Close below the Marubozu’s low confirms selling pressure.
Confirm the Pattern with Post-Marubozu Action
- Bullish Marubozu: The next candle closing above the high confirms it. Until then it is only a candidate.
- Bearish Marubozu: The next candle closing below the low confirms it. Until then it is only a candidate.
Check Volume for Extra Confidence
Marubozu candles often come with rising volume, signaling conviction. Confirmation with steady or increasing volume strengthens both bullish and bearish outcomes.
Size Counts: A small candle with no wicks is not a Marubozu. The body has to stand out from the candles around it.
How to Read the Marubozu on a Chart (Worked Example)
To show how the rules apply, we will use XRPEUR on the 8-hour chart, a Bullish Marubozu marked and confirmed by the Trading Metrics pattern scanner.
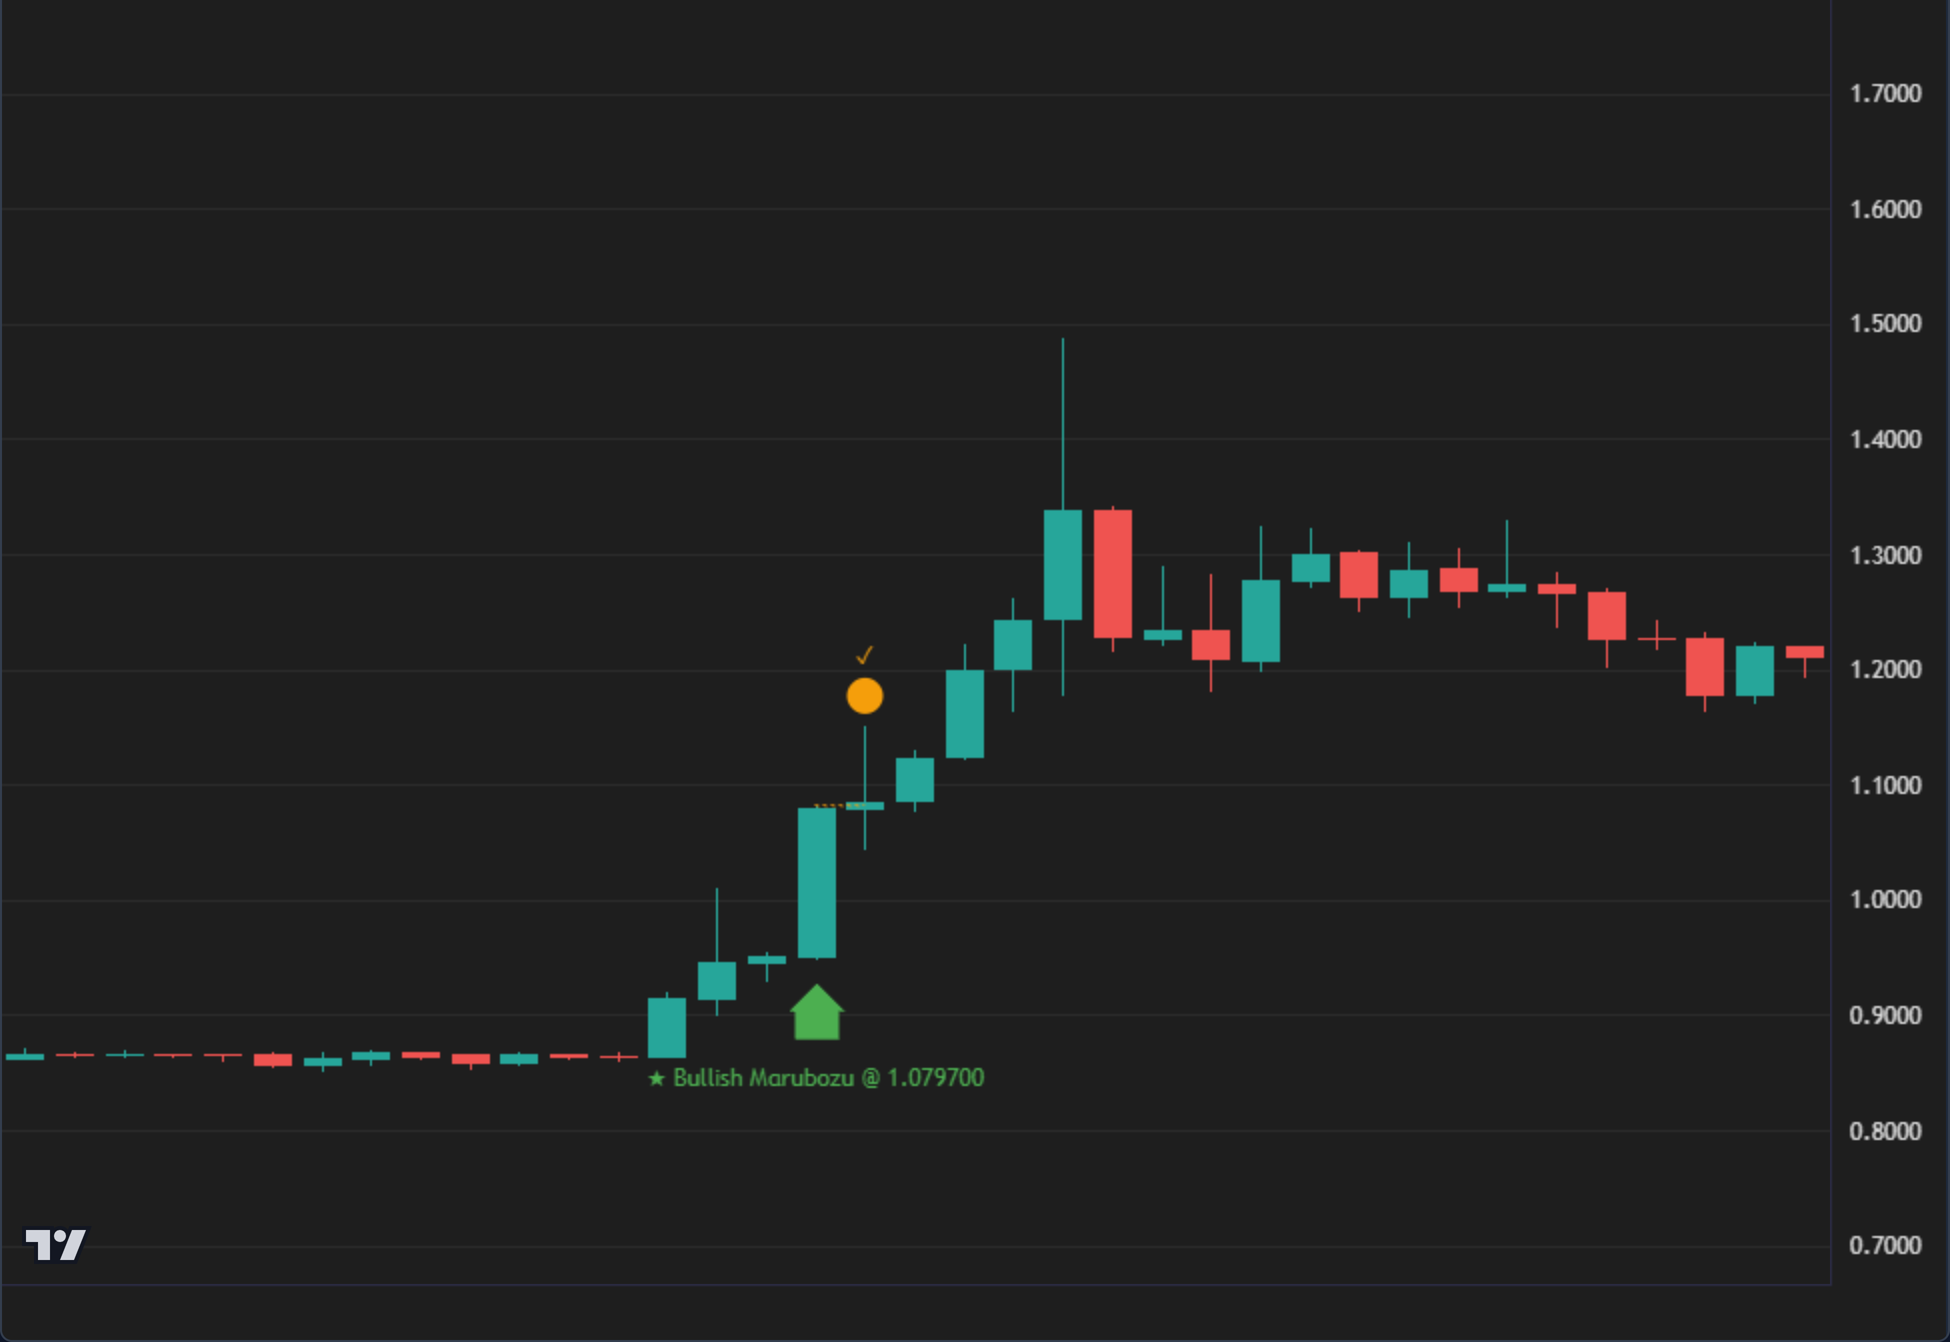
The Candle
The candle of August 20, 2026, 08:00 UTC opened at 0.9505 and closed at 1.0797, with a high of 1.0817 and a low of 0.9497. Its body fills 98% of its range, and the wick on the closing side is 1.5%. Buyers led from the open to the close.
The Confirmation
The next candle closed at 1.0849, above the Marubozu’s high of 1.0817, which confirmed the pattern. It was a thin break: confirmation says the pattern is complete, not how far the price will go.
Its Limits
- Already moved: By the time the candle closed, the price had risen about 13.6% from its open.
- Failure level: A close back below the candle’s low of 0.9497 would have meant the push had failed.
- One chart: This shows how the rules are read, not what the next Marubozu will do. Risk and reward are for your own plan.
A volume spike on the Marubozu candle reinforces the move, whether bullish or bearish.
Pre-Trade Checklist
Prove the Thrust: Combine the pattern with volume surges and indicators like RSI to avoid traps and enhance precision.
Key Points
- Body Power: A long body with minimal shadows defines its strength - shadows reduce impact.
- Time Frame: Most effective on daily or weekly charts in trending markets.
- Combine with Indicators: Pair with moving averages or RSI to confirm momentum.
- Breakout Confirmation: A close above the high (bullish) or below the low (bearish) confirms direction - don’t guess early.
- Failure: A close back beyond the other end of the candle means the push has failed.
Wait for the Close: Until the next candle closes beyond it, a Marubozu is only a candidate.
Conclusion
The Marubozu pattern, whether bullish or bearish, signals strong directional momentum. Its clean structure makes it easy to spot, and volume, RSI and moving averages add context. In bullish form, it highlights buying dominance; in bearish form, it reflects strong selling pressure. Whether in crypto or stocks, wait for the next close, remember that much of the move has already happened, and let your own plan define the risk.
Frequently Asked Questions
Quick answers based on this page's topic.
A Marubozu is a single-candle pattern with a long real body and little to no wicks. It signals 'Total Conviction,' showing that one side of the market led from the open to the close without any retracement that lasted. It is the purest visual representation of directional momentum.
No. Trading Metrics reads it as momentum: the push is more likely to carry on, and its scanner does not require a prior trend. But after an extended move it can be the last push rather than the first, an 'Exhaustion' or 'Blow-off top' candle. And by the time it closes, a big part of the move has already happened.
By the next candle. A Bullish Marubozu is confirmed when the next candle closes above its high, a Bearish Marubozu when the next candle closes below its low. Until then it is only a candidate. If price later closes back beyond the other end of the candle, the push has failed.