Three White Soldiers: Reading a Three-Bar Bullish Surge
The Three White Soldiers pattern is made of three strong bullish candles in a row, each opening inside the body before it and closing higher. On the old candle charts a rising candle was drawn white, so the soldiers march up. Many traders read the pattern as a bullish reversal, but Trading Metrics reads it as momentum: the push is more likely to carry on. After a long run, three strong candles can also be the last push rather than the first. Its mirror is the Three Black Crows.
How to Identify the Three White Soldiers Pattern in Trading
Spotting Three White Soldiers means checking three things on three candles: big bodies, opens inside the last body, and closes that keep rising. Here’s the step-by-step guide.
Trace the Candle Sequence
The setup develops over three candles:
- First Candle: A long bullish candle with a big body.
- Second Candle: Another strong bullish candle, opening within the first candle’s body and closing higher.
- Third Candle: A third strong bullish candle, opening within the second candle’s body and closing higher again.
Each candle opens a little below the last close: sellers get a moment, and buyers take it back.
Check the Scanner’s Rules
The Trading Metrics scanner asks for three green candles, each with a body of at least half of its candle’s range, each opening inside the body before it, and each closing higher than the last. It also checks that the move is large enough for the timeframe. It has no prior-trend condition.
Zero in on the Confirmation Level
The confirmation level is the high of the third candle.
Wait for the Next Close
The pattern is confirmed when the next candle closes above the third candle’s high. Until then it is only a candidate.
Check Volume for Extra Confidence
Volume rising across the three candles adds evidence that the buying had real participation, though it is not part of the pattern’s definition.
Same March, Tired: Three rising candles with shrinking bodies and growing upper wicks are an advance block. Buyers still push up, but sellers push them back before the close.
How to Read Three White Soldiers on a Chart (Worked Example)
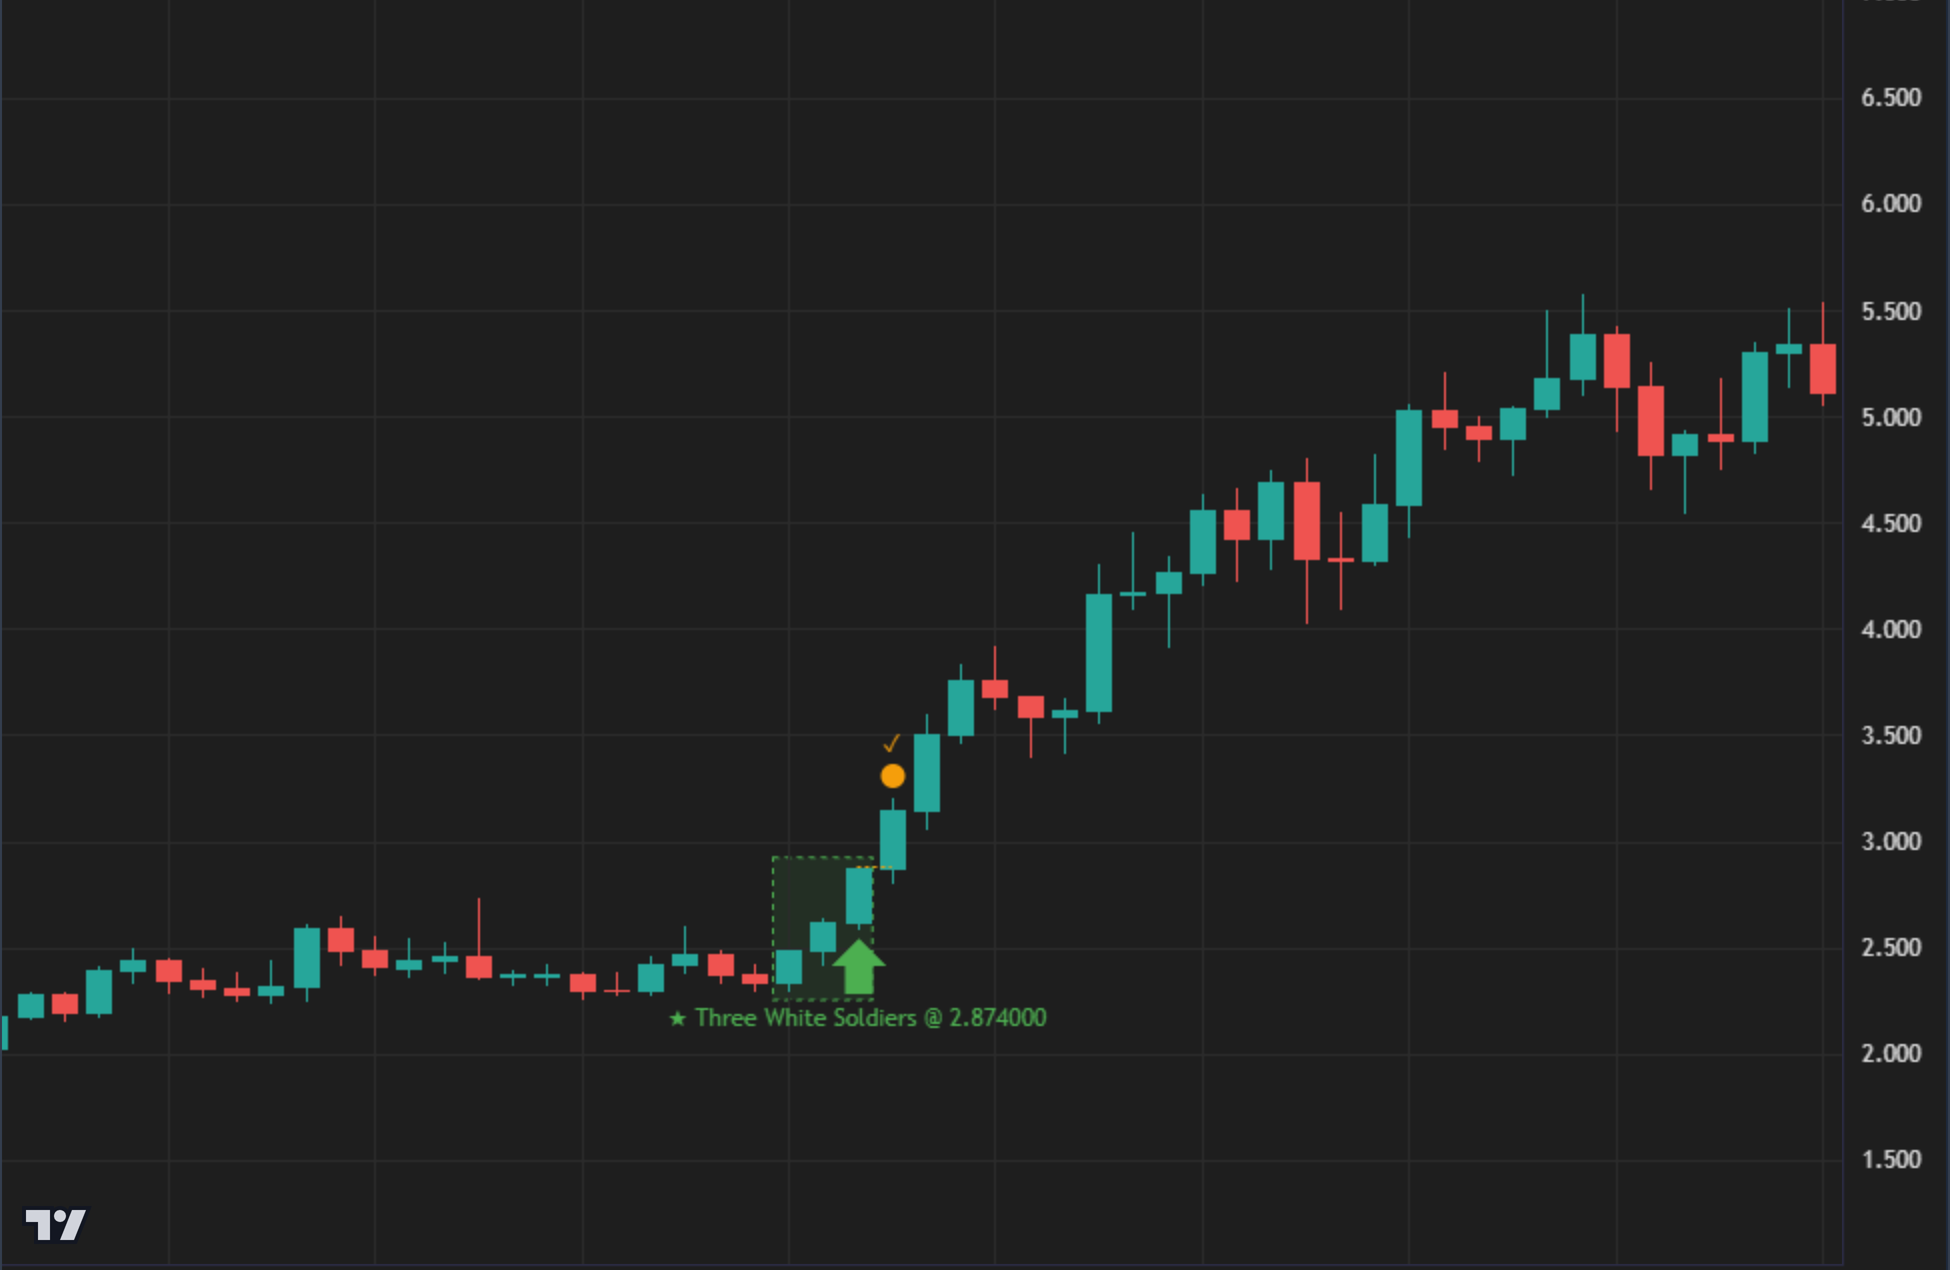
To show how the rules apply, we will use NEARUSDT on the 12-hour chart, a Three White Soldiers pattern marked and confirmed by the Trading Metrics pattern scanner.
The Candles
The three candles of September 16, 2026, 00:00 UTC to September 17, 2026, 00:00 UTC each closed higher: 2.486, 2.621 and 2.874. Their bodies fill 78%, 64% and 88% of their ranges, and each opened at the top of the body before it.
The Confirmation
The next candle closed at 3.147, above the third candle’s high of 2.877, which confirmed the pattern. The rise carried on to a 3.763 close on September 18, 12:00 UTC.
Its Limits
- Already moved: By the third close, the price had risen about 23% from the first candle’s open of 2.337.
- Failure level: A close back below 2.337, where the three candles began, would have meant the march had failed.
- One chart: This shows how the rules are read, not what the next Three White Soldiers will do. Patterns like this can also come right before a change in trend. Risk and reward are for your own plan.
Volume Advance: Rising volume across the soldiers adds evidence that the buying is real.
Pre-Trade Checklist
Check the March: Pair the pattern with volume and indicators like RSI to tell a fresh march from a tired one.
Key Points
- Soldier Consistency: Three big bodies, each at least half its candle - small or shrinking candles dilute it.
- No Gaps: Each candle opens inside the last body; a jump above it breaks the march.
- Momentum, Not a Promise: Trading Metrics reads it as momentum; in its test it landed in the top group, a measurement of past charts.
- Confirmation: A close above the third candle’s high confirms it - don’t call it early.
- Already Moved: Much of the move has happened by the third close.
- Failure: A close back below where the three candles began means the march has failed.
Wait for the Close: Until the next candle closes above the third candle’s high, the pattern is only a candidate.
Conclusion
The Three White Soldiers pattern shows buying that keeps coming back, three candles in a row. Its rules are simple: big bodies, opens inside the last body, closes that keep rising. Volume, RSI and moving averages add context. Whether in crypto or stocks, wait for the next close, watch for the tired version, remember that much of the move has already happened, and let your own plan define the risk.
Frequently Asked Questions
Quick answers based on this page's topic.
This pattern consists of three consecutive long-bodied green candles that each open within the previous body and close progressively higher. Each candle opens a little below the last close, sellers get a moment, and buyers take it back and close higher again, three times in a row. It is not one burst: it is buying that keeps coming back.
Many traders read it as a reversal at the bottom of a downtrend. Trading Metrics reads it as momentum: the push is more likely to carry on, and its scanner does not require a prior trend. Tested that way, it landed in the app's top group, which is what past charts measured, not a promise. After a long run, three strong candles can also be the last push rather than the first.
By the next candle. The pattern is confirmed when the next candle closes above the third candle's high. Until then it is only a candidate. If price later closes back below where the three candles began (the first candle's open), the march has failed.
Three rising candles where each body is smaller than the last and the upper wicks grow longer. Buyers still push up, but sellers push them back before the close: the same march, tired. The Trading Metrics scanner wants every body to be at least half its candle, so the most tired versions never count.